The Dividend Investing Resource Center
Discover how Dividend Reinvestment Plans (DRIPs) can amplify your investment portfolio by automatically reinvesting company dividends into additional shares.
By leveraging the power of compounding, you can escalate your shareholdings over time.
What is dividend investing?
Dividend investing is a means of building wealth over a long period of time with reduced risk.
Many brokers offer fee-free purchases and reinvestments and the ability to reinvest fractional shares.
Dividend investing is for the long term buy-and-hold type investor who wants to sleep at night while their investments steadily build.
What is DRIP?
The term DRIP is an abbreviation for dividend reinvestment plans, which offer investors the opportunity to reinvest all, or a portion, of their dividend payments back into a company’s stock. Oftentimes, companies will allow investors to purchase additional shares of stock through these programs too.
What is DRIP investing?
Dividend reinvestment plans are sponsored by companies that allow individual investors to purchase common stock without going through a broker. The name comes from the plan’s policy of allowing the investor to automatically reinvest dividends to purchase additional shares of stock.
Many DRIPs are offered to investors free of any participation costs, while others charge relatively small administration fees or commissions. While the name implies these plans are limited to reinvesting stock dividends, some plans allow participants to directly purchase a company’s stock. This enhanced practice is sometimes referred to as optional cash purchases or OCPs.
Advantages of DRIP
A large number of companies offer dividend reinvestment programs, and participation rules are usually outlined in the investor section of the company’s website. Since these plans are flexible enough to allow even small purchases without a broker’s fee, it’s hard to find any downside to these offerings. In fact, there are several significant advantages of these programs including:
Low cost of entry
Investors don’t need a lot of money to enroll in these programs.
Most companies allow the purchase of just a single share of stock, and often this purchase is at a discount.
Cost-effective
Since the investor isn’t paying brokerage fees, all of the money is put to work.
Over 100 companies allow investors to purchase stock at a discount to the current market price through optional cash purchase plans, or OCPs.
DCA
Finally, many of the DRIPs allow investors to purchase stock through automated weekly or monthly deductions.
This long-term purchase strategy provides the investor with a less painful, and more structured, approach to buying stocks.
CCC list
Most Popular Dividend Stocks
Here are some of the top-performing and most popular dividend stocks.
| Logo | Symbol | Stock Type | Company | Sector | Industry | Price | Div Yield | 5Y Avg Yield | Current Div | Payouts/Year | Annualized | Previous Div | Ex-Date | Pay-Date | Low | High | Chowder Number | DGR 1Y | DGR 3Y | DGR 5Y | DGR 10Y | TTR 1Y | TTR 3Y | FV (Peter Lynch) | FV (Peter Lynch) % | EPS 1Y | Revenue 1Y | NPM | CF/Share | ROE | Current R | Debt/Capital | ROTC | P/E | P/BV | PEG |
|---|---|---|---|---|---|---|---|---|---|---|---|---|---|---|---|---|---|---|---|---|---|---|---|---|---|---|---|---|---|---|---|---|---|---|---|---|
|
| VST | Challenger | Vistra Corp. | Utilities | Utilities – Independent Power Producers | $165.89 | 0.55% | 1.53% | $0.228 | 4 | $0.912 | $0.227 | Jun 22, 2026 | Jun 30, 2026 | $132.66 | $219.82 | 4.2 | -23.6% | -4.4% | 3.6% | — | -9.7% | 89.2% | $53.85 | 208.0% | 0.0% | 3.0% | 10.5% | $13.85 | 42.9% | 0.9 | 85.0% | 10.8% | 27.7x | 21.4x | 0.48 |
|
| LRCX | Contender | Lam Research Corporation | Technology | Semiconductor Equipment & Materials | $399.52 | 0.26% | 0.94% | $0.260 | 4 | $1.040 | $0.260 | Jun 17, 2026 | Jul 8, 2026 | $90.29 | $402.00 | 15.1 | 13.0% | 14.7% | 14.9% | 24.1% | 345.1% | 87.9% | $26.45 | 1,411.0% | 0.0% | 23.7% | 30.9% | $5.56 | 66.8% | 2.5 | 26.0% | 48.2% | 75.5x | 47.2x | 2.26 |
|
| AVGO | Contender | Broadcom Inc. | Technology | Semiconductors | $398.33 | 0.65% | 1.60% | $0.650 | 4 | $2.600 | $0.650 | Jun 22, 2026 | Jun 30, 2026 | $246.46 | $495.00 | 6.8 | -33.1% | 1.8% | 6.1% | 26.2% | 61.0% | 70.1% | $30.05 | 1,226.0% | 0.0% | 23.9% | 38.9% | $7.07 | 37.3% | 2.2 | 42.0% | 20.5% | 66.3x | 21.6x | 0.75 |
|
| AMAT | Challenger | Applied Materials, Inc. | Technology | Semiconductor Equipment & Materials | $627.03 | 0.34% | 0.78% | $0.530 | 4 | $2.120 | $0.460 | Aug 20, 2026 | Sep 10, 2026 | $154.47 | $639.18 | 16.6 | 15.1% | 20.2% | 16.2% | 16.9% | 273.9% | 66.8% | $53.05 | 1,083.0% | 0.0% | 4.4% | 29.3% | $10.07 | 39.7% | 2.5 | 20.0% | 30.6% | 59.1x | 20.8x | 2.05 |
|
| CAT | Champion | Caterpillar, Inc. | Industrials | Farm & Heavy Construction Machinery | $1,011.35 | 0.60% | 1.61% | $1.510 | 4 | $6.040 | $1.510 | Jul 20, 2026 | Aug 19, 2026 | $357.73 | $1,015.92 | 8.5 | 7.1% | 8.0% | 8.0% | 7.0% | 185.3% | 64.9% | $100.55 | 906.0% | 0.0% | 4.3% | 13.3% | $26.75 | 51.3% | 1.4 | 62.0% | 19.2% | 50.3x | 25.0x | 2.34 |
|
| GS | Contender | Goldman Sachs Group, Inc. (The) | Financial Services | Capital Markets | $1,099.40 | 1.64% | 2.33% | $4.500 | 4 | $18.000 | $4.500 | Jun 1, 2026 | Jun 29, 2026 | $630.01 | $1,125.00 | 29.4 | 41.7% | 19.3% | 27.7% | 20.7% | 77.7% | 55.3% | $273.60 | 302.0% | 0.0% | 8.9% | 28.3% | $-134.88 | 14.6% | 1.5 | 75.0% | 4.2% | 20.1x | 3.1x | 1.69 |
|
| MS | Contender | Morgan Stanley | Financial Services | Capital Markets | $226.29 | 1.77% | 3.11% | $1.000 | 4 | $4.000 | $1.000 | Apr 30, 2026 | May 15, 2026 | $130.90 | $230.47 | 25.1 | 8.1% | 8.9% | 23.4% | 20.9% | 77.7% | 44.2% | $55.25 | 310.0% | 0.0% | 14.4% | 23.8% | $-0.64 | 16.4% | 2.0 | 78.0% | 3.9% | 20.5x | 3.4x | 2.68 |
|
| CSCO | Contender | Cisco Systems, Inc. | Technology | Communication Equipment | $121.25 | 1.39% | 2.74% | $0.420 | 4 | $1.680 | $0.410 | Jul 6, 2026 | Jul 22, 2026 | $65.75 | $130.37 | 4.0 | 2.5% | 2.5% | 2.6% | 6.4% | 89.6% | 37.7% | $15.00 | 708.0% | 0.0% | 5.3% | 20.1% | $3.30 | 25.2% | 0.9 | 28.0% | 17.8% | 40.4x | 9.8x | 1.66 |
|
| JPM | Contender | JP Morgan Chase & Co. | Financial Services | Banks – Diversified | $328.94 | 1.82% | 2.41% | $1.500 | 4 | $6.000 | $1.500 | Jul 6, 2026 | Jul 31, 2026 | $272.11 | $338.09 | 12.2 | 16.8% | 13.8% | 10.4% | 12.9% | 24.1% | 37.0% | $104.40 | 215.0% | 0.0% | 2.8% | 30.8% | $-40.20 | 16.5% | — | 57.0% | 7.4% | 15.8x | 2.6x | 1.73 |
|
| MFC | Contender | Manulife Financial Corporation | Financial Services | Insurance – Life | $40.88 | 1.72% | 4.29% | $0.352 | 2 | $0.704 | $0.354 | May 29, 2026 | Jun 19, 2026 | $29.70 | $41.43 | -2.6 | -41.3% | -12.1% | -4.3% | 2.8% | 38.2% | 36.0% | $12.40 | 230.0% | 0.0% | 14.4% | 20.0% | $17.27 | 12.6% | 30.1 | 23.0% | 10.7% | 16.5x | 2.0x | 0.78 |
|
| LLY | Contender | Eli Lilly and Company | Healthcare | Drug Manufacturers – General | $1,098.03 | 0.63% | 0.81% | $1.730 | 4 | $6.920 | $1.730 | May 15, 2026 | Jun 10, 2026 | $623.78 | $1,182.73 | 15.9 | 15.4% | 15.2% | 15.2% | 12.3% | 45.8% | 35.1% | $140.60 | 681.0% | 0.0% | 44.7% | 35.0% | $22.97 | 107.5% | 1.5 | 56.0% | 39.6% | 39.1x | 31.5x | 1.47 |
|
| RY | Contender | Royal Bank Of Canada | Financial Services | Banks – Diversified | $202.00 | 1.78% | 3.25% | $1.200 | 3 | $3.600 | $1.132 | Jul 27, 2026 | Aug 24, 2026 | $126.02 | $202.90 | -5.1 | -43.8% | -15.7% | -6.9% | -0.2% | 63.0% | 33.6% | $54.95 | 268.0% | 0.0% | 16.2% | 31.0% | $-44.16 | 16.2% | — | 74.0% | 4.5% | 18.4x | 3.0x | 2.53 |
|
| WMT | King | Walmart Inc. | Consumer Defensive | Discount Stores | $117.60 | 0.84% | 1.14% | $0.248 | 4 | $0.992 | $0.248 | Aug 21, 2026 | Jan 4, 2027 | $94.23 | $135.16 | 6.7 | 9.0% | 8.6% | 5.9% | 3.9% | 24.4% | 33.1% | $14.20 | 728.0% | 0.0% | 4.7% | 3.2% | $5.14 | 24.1% | 0.8 | 38.0% | 15.1% | 41.4x | 9.4x | 4.61 |
|
| MPLX | Contender | MPLX LP | Energy | Oil & Gas Midstream | $56.72 | 7.60% | 9.22% | $1.077 | 4 | $4.308 | $1.077 | May 8, 2026 | May 15, 2026 | $47.80 | $59.98 | 16.4 | 12.6% | 11.4% | 8.8% | 8.1% | 28.2% | 32.6% | $23.10 | 146.0% | 0.0% | 8.9% | 36.4% | $5.92 | 33.4% | 1.1 | 64.0% | 12.5% | 12.3x | 4.1x | 3.40 |
|
| KMI | Challenger | Kinder Morgan, Inc. | Energy | Oil & Gas Midstream | $31.76 | 3.75% | 5.54% | $0.298 | 4 | $1.192 | $0.293 | May 4, 2026 | May 15, 2026 | $25.60 | $34.81 | 5.9 | 1.7% | 1.8% | 2.1% | -0.6% | 22.5% | 32.5% | $7.45 | 326.0% | 0.0% | 12.2% | 18.9% | $2.81 | 10.6% | 0.5 | 49.0% | 5.4% | 21.3x | 2.3x | 3.74 |
|
| BAC | Contender | Bank of America Corporation | Financial Services | Banks – Diversified | $57.51 | 1.95% | 2.37% | $0.280 | 4 | $1.120 | $0.280 | Jun 5, 2026 | Jun 26, 2026 | $44.75 | $57.98 | 11.2 | 7.7% | 8.4% | 9.2% | 18.8% | 31.7% | 31.2% | $20.15 | 185.0% | 0.0% | 11.0% | 26.8% | $7.97 | 10.6% | — | 52.0% | 5.2% | 14.3x | 1.5x | 1.00 |
|
| PNC | Contender | PNC Financial Services Group, I | Financial Services | Banks – Regional | $234.52 | 2.90% | 3.64% | $1.700 | 4 | $6.800 | $1.700 | Apr 14, 2026 | May 5, 2026 | $176.17 | $243.94 | 11.0 | 6.3% | 4.3% | 8.1% | 12.8% | 40.6% | 29.9% | $86.10 | 172.0% | 0.0% | 7.2% | 28.8% | $16.99 | 12.1% | — | 51.0% | 5.6% | 13.6x | 1.6x | 1.84 |
|
| MO | King | Altria Group, Inc. | Consumer Defensive | Tobacco | $73.79 | 5.75% | 8.38% | $1.060 | 4 | $4.240 | $1.060 | Jun 15, 2026 | Jul 10, 2026 | $54.70 | $74.56 | 10.0 | 3.9% | 4.1% | 4.3% | 6.5% | 41.8% | 29.7% | $23.95 | 208.0% | 0.0% | -1.5% | 39.5% | $5.33 | — | 0.6 | 1.2% | 38.6% | 15.4x | —x | 1.69 |
|
| USB | Contender | U.S. Bancorp | Financial Services | Banks – Regional | $58.75 | 2.66% | 4.21% | $0.520 | 3 | $1.560 | $0.520 | Jun 30, 2026 | Jul 15, 2026 | $42.93 | $61.19 | 6.8 | 3.5% | 2.7% | 4.2% | 7.3% | 46.4% | 29.5% | $23.85 | 146.0% | 0.0% | 4.8% | 25.6% | $6.17 | 12.4% | — | 51.0% | 6.2% | 12.3x | 1.6x | 2.13 |
|
| ASB | Contender | Associated Banc-Corp | Financial Services | Banks – Regional | $29.52 | 3.25% | 3.86% | $0.240 | 4 | $0.960 | $0.240 | Jun 1, 2026 | Jun 15, 2026 | $22.89 | $29.96 | 9.0 | 4.4% | 4.6% | 5.7% | 8.2% | 36.8% | 29.1% | $14.40 | 105.0% | 0.0% | 43.3% | 31.5% | $3.46 | 10.2% | — | 17.0% | 8.4% | 10.3x | 1.0x | 1.78 |
|
| PM | Contender | Philip Morris International Inc | Consumer Defensive | Tobacco | $176.67 | 3.33% | 4.43% | $1.470 | 4 | $5.880 | $1.470 | Jun 25, 2026 | Jul 20, 2026 | $142.11 | $193.05 | 13.2 | 42.2% | -3.1% | 9.9% | 3.5% | 3.1% | 29.1% | $35.50 | 398.0% | 0.0% | 7.3% | 26.7% | $7.82 | — | 1.0 | 1.3% | 33.9% | 24.9x | —x | 2.49 |
|
| TXN | Contender | Texas Instruments Incorporated | Technology | Semiconductors | $332.90 | 1.71% | 2.75% | $1.420 | 4 | $5.680 | $1.420 | May 5, 2026 | May 19, 2026 | $152.73 | $334.03 | 9.0 | 4.5% | 4.9% | 7.3% | 14.3% | 75.6% | 28.9% | $29.20 | 1,040.0% | 0.0% | 13.1% | 29.1% | $8.60 | 32.4% | 4.5 | 43.0% | 17.9% | 57.0x | 18.1x | 1.54 |
|
| QCOM | Contender | QUALCOMM Incorporated | Technology | Semiconductors | $229.49 | 1.60% | 2.06% | $0.920 | 4 | $3.680 | $0.890 | Jun 4, 2026 | Jun 25, 2026 | $121.99 | $259.92 | 8.0 | 4.4% | 5.6% | 6.4% | 6.2% | 57.3% | 28.8% | $232.25 | -1.0% | 0.0% | 13.3% | 22.3% | $13.55 | 36.1% | 2.4 | 35.0% | 25.1% | 24.7x | 8.9x | 0.96 |
|
| IBM | Champion | International Business Machines | Technology | Information Technology Services | $247.67 | 2.73% | 3.73% | $1.690 | 4 | $6.760 | $1.680 | May 8, 2026 | Jun 10, 2026 | $212.34 | $332.46 | 4.2 | 0.6% | 0.6% | 1.5% | 2.9% | -7.1% | 28.8% | $56.55 | 338.0% | 0.0% | 7.6% | 15.6% | $14.89 | 35.8% | 0.8 | 65.0% | 12.1% | 21.9x | 7.1x | 2.33 |
|
| PSX | Contender | Phillips 66 | Energy | Oil & Gas Refining & Marketing | $166.42 | 3.05% | 3.58% | $1.270 | 4 | $5.080 | $1.270 | May 18, 2026 | Jun 1, 2026 | $118.00 | $190.61 | 9.6 | 6.2% | 6.9% | 6.5% | 7.9% | 42.0% | 27.9% | $50.60 | 229.0% | 0.0% | -6.1% | 3.0% | $6.26 | 14.6% | 1.1 | 40.0% | 8.9% | 16.4x | 2.3x | 0.96 |
|
| RTX | Champion | RTX Corporation | Industrials | Aerospace & Defense | $182.80 | 1.60% | 2.05% | $0.730 | 4 | $2.920 | $0.680 | May 22, 2026 | Jun 11, 2026 | $140.47 | $214.50 | 9.0 | 7.8% | 7.3% | 7.4% | 5.5% | 28.6% | 26.8% | $26.65 | 586.0% | 0.0% | 9.7% | 8.0% | $8.26 | 11.6% | 1.0 | 34.0% | 7.1% | 34.3x | 3.7x | 2.54 |
|
| OMF | Challenger | OneMain Holdings, Inc. | Financial Services | Credit Services | $58.18 | 7.22% | 9.33% | $1.050 | 4 | $4.200 | $1.050 | May 11, 2026 | May 15, 2026 | $45.78 | $71.93 | -3.6 | 0.7% | 2.4% | -10.8% | — | 24.1% | 23.9% | $33.55 | 73.0% | 0.0% | 9.7% | 15.8% | $27.75 | 23.9% | — | 87.0% | 3.1% | 8.7x | 2.0x | 0.75 |
|
| COST | Contender | Costco Wholesale Corporation | Consumer Defensive | Discount Stores | $950.37 | 0.62% | 1.12% | $1.470 | 4 | $5.880 | $1.300 | May 1, 2026 | May 15, 2026 | $844.06 | $1,096.50 | -15.4 | 12.3% | 13.0% | -16.1% | 12.5% | -2.0% | 23.8% | $99.45 | 856.0% | 0.0% | 8.2% | 3.0% | $33.82 | 29.2% | 1.1 | 20.0% | 22.4% | 47.8x | 25.5x | 4.64 |
|
| ABBV | Contender | AbbVie Inc. | Healthcare | Drug Manufacturers – General | $227.01 | 3.05% | 3.57% | $1.730 | 4 | $6.920 | $1.730 | Jul 15, 2026 | Aug 14, 2026 | $181.73 | $244.81 | 9.4 | 5.6% | 5.3% | 6.3% | 12.1% | 30.3% | 23.7% | $10.20 | 2,126.0% | 0.0% | 8.6% | 5.8% | $12.01 | — | 0.8 | 1.1% | 6.1% | 111.3x | —x | 0.60 |
|
| ENB | Champion | Enbridge Inc | Energy | Oil & Gas Midstream | $54.87 | 3.87% | 6.32% | $0.707 | 3 | $2.121 | $0.712 | May 15, 2026 | Jun 1, 2026 | $43.59 | $58.45 | -0.1 | -21.3% | -7.4% | -4.0% | 3.4% | 32.4% | 22.9% | $10.55 | 420.0% | 0.0% | 21.9% | 9.4% | $5.29 | 10.1% | 0.8 | 64.0% | 4.1% | 26.0x | 2.9x | 5.27 |
|
| EPD | Champion | Enterprise Products Partners L. | Energy | Oil & Gas Midstream | $36.57 | 6.02% | 7.55% | $0.550 | 4 | $2.200 | $0.550 | Apr 30, 2026 | May 14, 2026 | $30.01 | $40.17 | 10.1 | 3.3% | 4.3% | 4.1% | 3.5% | 32.7% | 22.4% | $13.50 | 171.0% | 0.0% | -6.4% | 11.4% | $3.58 | 19.8% | 0.9 | 51.0% | 9.7% | 13.5x | 2.7x | 1.50 |
|
| MAIN | Contender | Main Street Capital Corporation | Financial Services | Asset Management | $50.99 | 6.12% | 8.44% | $0.260 | 12 | $3.120 | $0.260 | Jun 22, 2026 | Sep 15, 2026 | $48.95 | $67.77 | 18.2 | -4.3% | 7.0% | 12.1% | 4.0% | 1.3% | 22.2% | $23.75 | 115.0% | 0.0% | 4.7% | 74.9% | $-1.76 | 14.4% | 0.2 | 45.0% | 8.0% | 10.7x | 1.5x | 1.76 |
|
| GILD | Contender | Gilead Sciences, Inc. | Healthcare | Drug Manufacturers – General | $123.91 | 2.65% | 3.46% | $0.820 | 4 | $3.280 | $0.820 | Jun 15, 2026 | Jun 29, 2026 | $104.46 | $157.29 | 5.6 | 3.2% | 2.8% | 3.0% | 6.2% | 20.2% | 21.6% | $36.75 | 237.0% | 0.0% | 2.4% | 31.0% | $8.70 | 43.4% | 2.0 | 47.0% | 21.1% | 16.9x | 6.5x | 2.14 |
|
| AEP | Contender | American Electric Power Company | Utilities | Utilities – Regulated Electric | $129.40 | 2.94% | 3.51% | $0.950 | 4 | $3.800 | $0.950 | May 8, 2026 | Jun 10, 2026 | $101.15 | $139.44 | 8.2 | 3.0% | 4.9% | 5.3% | 5.5% | 35.0% | 20.5% | $33.75 | 283.0% | 0.0% | 10.9% | 16.3% | $12.89 | 12.6% | 0.5 | 60.0% | 4.8% | 19.2x | 2.2x | 2.34 |
|
| CNQ | Contender | Canadian Natural Resources Limi | Energy | Oil & Gas E&P | $41.29 | 2.20% | 4.21% | $0.455 | 2 | $0.910 | $0.432 | Jun 22, 2026 | Jul 7, 2026 | $29.30 | $51.34 | -5.9 | -71.9% | -37.3% | -8.1% | 3.1% | 26.2% | 19.7% | $87.00 | -53.0% | 0.0% | 8.7% | 25.1% | $6.76 | 22.8% | 1.0 | — | 16.8% | 11.9x | 2.7x | 3.42 |
|
| FANG | Challenger | Diamondback Energy, Inc. | Energy | Oil & Gas E&P | $185.80 | 2.37% | 4.49% | $1.100 | 4 | $4.400 | $1.050 | May 14, 2026 | May 21, 2026 | $134.30 | $214.51 | 24.1 | -20.8% | -23.0% | 21.8% | — | 30.9% | 19.0% | $4.85 | 3,731.0% | 0.0% | 35.8% | 1.9% | $29.26 | 0.5% | 0.6 | 26.0% | 0.5% | 191.6x | 1.4x | 56.78 |
|
| AMGN | Contender | Amgen Inc. | Healthcare | Drug Manufacturers – General | $341.92 | 2.95% | 3.02% | $2.520 | 4 | $10.080 | $2.520 | May 15, 2026 | Jun 5, 2026 | $267.83 | $391.29 | 10.8 | 5.8% | 6.4% | 7.8% | 10.6% | 25.2% | 18.9% | $71.90 | 376.0% | 0.0% | 10.0% | 21.0% | $19.93 | 101.3% | 1.3 | 85.0% | 12.8% | 23.8x | 20.1x | 2.23 |
|
| HTGC | Challenger | Hercules Capital, Inc. | Financial Services | Asset Management | $15.43 | 12.18% | 13.23% | $0.470 | 4 | $1.880 | $0.470 | May 14, 2026 | May 21, 2026 | $13.70 | $19.67 | 18.0 | 3.3% | -1.2% | 5.8% | 4.2% | 7.6% | 18.8% | $8.95 | 72.0% | 0.0% | 7.9% | 59.9% | $-2.32 | 15.7% | 0.1 | 53.0% | 7.4% | 8.6x | 1.3x | 0.52 |
|
| VZ | Contender | Verizon Communications Inc. | Communication Services | Telecom Services | $45.55 | 6.22% | 6.64% | $0.708 | 4 | $2.832 | $0.690 | Jul 10, 2026 | Aug 3, 2026 | $38.39 | $51.68 | 8.3 | 2.5% | 2.1% | 2.1% | 2.1% | 23.7% | 18.2% | $20.50 | 122.0% | 0.0% | 2.5% | 12.5% | $8.94 | 17.2% | 0.6 | 61.0% | 6.8% | 11.1x | 1.8x | 0.85 |
|
| BEN | Champion | Franklin Resources, Inc. | Financial Services | Asset Management | $34.14 | 3.87% | 4.85% | $0.330 | 4 | $1.320 | $0.330 | Jun 29, 2026 | Jul 10, 2026 | $21.11 | $34.34 | 7.3 | 3.2% | 3.3% | 3.4% | 7.0% | 64.4% | 17.9% | $6.55 | 421.0% | 0.0% | 3.5% | 5.2% | $1.88 | 6.7% | 6.3 | 56.0% | 1.8% | 26.1x | 1.5x | 0.41 |
|
| AAPL | Contender | Apple Inc. | Technology | Consumer Electronics | $300.06 | 0.36% | 0.45% | $0.270 | 4 | $1.080 | $0.260 | May 11, 2026 | May 14, 2026 | $198.96 | $317.40 | 5.0 | 4.0% | 4.1% | 4.7% | 7.0% | 50.4% | 17.8% | $41.25 | 627.0% | 0.0% | 6.4% | 27.2% | $9.55 | 141.5% | 1.1 | 41.0% | 75.9% | 36.4x | 41.3x | 2.41 |
|
| AMP | Contender | Ameriprise Financial, Inc. | Financial Services | Asset Management | $528.90 | 1.29% | 1.35% | $1.700 | 4 | $6.800 | $1.600 | Aug 3, 2026 | Aug 21, 2026 | $422.37 | $550.18 | 10.2 | 7.6% | 8.4% | 8.9% | 8.9% | 4.1% | 17.0% | $20.10 | 2,531.0% | 0.0% | 7.1% | 20.4% | $0.00 | 63.4% | 8.8 | — | 32.9% | 131.6x | 7.3x | 1.74 |
|
| DUK | Contender | Duke Energy Corporation (Holdin | Utilities | Utilities – Regulated Electric | $124.38 | 3.43% | 3.78% | $1.065 | 4 | $4.260 | $1.065 | May 15, 2026 | Jun 16, 2026 | $113.90 | $134.49 | 5.4 | 1.9% | 2.0% | 2.0% | 2.6% | 15.4% | 16.7% | $32.50 | 283.0% | 0.0% | 6.2% | 15.3% | $14.96 | 9.7% | 0.7 | 60.0% | 3.9% | 19.1x | 1.8x | 2.62 |
|
| ORCL | Contender | Oracle Corporation | Technology | Software – Infrastructure | $180.82 | 1.11% | 1.21% | $0.500 | 4 | $2.000 | $0.500 | Jul 10, 2026 | Jul 24, 2026 | $134.57 | $345.72 | 15.1 | 17.6% | 13.7% | 14.0% | 12.8% | -10.0% | 16.2% | $29.10 | 521.0% | 0.0% | 17.4% | 25.2% | $11.12 | 53.4% | 1.1 | — | 12.1% | 31.1x | 15.5x | 1.04 |
|
| PRU | Contender | Prudential Financial, Inc. | Financial Services | Insurance – Life | $108.72 | 5.15% | 4.95% | $1.400 | 4 | $5.600 | $1.400 | May 26, 2026 | Jun 11, 2026 | $91.89 | $119.76 | 9.2 | 3.8% | 3.9% | 4.1% | 7.5% | 15.4% | 16.1% | $48.50 | 124.0% | 0.0% | -15.3% | 5.8% | $28.17 | 10.7% | 0.8 | 41.0% | 6.6% | 11.2x | 1.2x | 1.16 |
|
| CSL | Champion | Carlisle Companies Incorporated | Industrials | Building Products & Equipment | $359.11 | 1.23% | 1.00% | $1.100 | 4 | $4.400 | $1.100 | May 18, 2026 | Jun 1, 2026 | $293.43 | $435.92 | 17.2 | 10.0% | 13.6% | 15.9% | 13.9% | 3.8% | 16.0% | $85.75 | 319.0% | 0.0% | 0.3% | 14.6% | $26.08 | 38.2% | 3.4 | 64.0% | 16.0% | 20.9x | 8.8x | 1.15 |
|
| JNJ | King | Johnson & Johnson | Healthcare | Drug Manufacturers – General | $229.74 | 2.33% | 2.72% | $1.340 | 4 | $5.360 | $1.300 | May 26, 2026 | Jun 9, 2026 | $149.74 | $251.71 | 7.4 | 4.4% | 4.6% | 5.1% | 5.6% | 60.8% | 15.7% | $43.15 | 432.0% | 0.0% | 6.1% | 21.8% | $9.50 | 26.4% | 1.0 | 32.0% | 17.7% | 26.6x | 6.8x | 2.97 |
|
| KO | King | Coca-Cola Company (The) | Consumer Defensive | Beverages – Non-Alcoholic | $82.63 | 2.57% | 2.83% | $0.530 | 4 | $2.120 | $0.530 | Jun 15, 2026 | Jul 1, 2026 | $65.35 | $84.04 | 7.2 | 4.5% | 4.9% | 4.6% | 4.3% | 23.9% | 15.5% | $15.90 | 420.0% | 0.0% | 2.5% | 27.8% | $3.40 | 43.4% | 1.4 | 54.0% | 18.6% | 26.0x | 10.6x | 4.22 |
|
| XOM | Champion | Exxon Mobil Corporation | Energy | Oil & Gas Integrated | $137.47 | 3.00% | 3.34% | $1.030 | 4 | $4.120 | $1.030 | May 15, 2026 | Jun 10, 2026 | $105.53 | $176.41 | 6.2 | 4.1% | 4.2% | 3.2% | 3.3% | 27.3% | 14.8% | $29.70 | 363.0% | 0.0% | -5.0% | 7.6% | $11.51 | 9.9% | 1.0 | 12.0% | 8.7% | 23.1x | 2.2x | 1.14 |
|
| SO | Contender | Southern Company (The) | Utilities | Utilities – Regulated Electric | $93.58 | 3.25% | 3.52% | $0.760 | 4 | $3.040 | $0.740 | May 18, 2026 | Jun 8, 2026 | $83.80 | $100.84 | 6.2 | 2.8% | 2.8% | 2.9% | 3.1% | 11.7% | 14.6% | $19.55 | 379.0% | 0.0% | 10.6% | 14.5% | $8.67 | 11.0% | 0.7 | 65.0% | 4.3% | 23.9x | 2.8x | 2.65 |
|
| V | Contender | Visa Inc. | Financial Services | Credit Services | $331.49 | 0.81% | 0.70% | $0.670 | 4 | $2.680 | $0.670 | May 12, 2026 | Jun 1, 2026 | $293.89 | $359.66 | 16.4 | 13.5% | 14.7% | 15.6% | 17.0% | -0.5% | 14.4% | $57.45 | 477.0% | 0.0% | 11.3% | 51.7% | $13.71 | 60.4% | 1.1 | 39.0% | 38.8% | 28.9x | 17.8x | 1.44 |
|
| FRT | King | Federal Realty Investment Trust | Real Estate | REIT – Retail | $126.08 | 3.59% | 4.26% | $1.130 | 4 | $4.520 | $1.130 | Jul 1, 2026 | Jul 15, 2026 | $89.99 | $126.86 | 4.9 | 2.7% | 1.5% | 1.3% | 1.9% | 44.6% | 13.9% | $28.85 | 337.0% | 0.0% | 6.4% | 38.1% | $7.27 | 14.8% | 0.7 | 61.0% | 6.3% | 21.9x | 3.5x | 3.59 |
|
| CSX | Contender | CSX Corporation | Industrials | Railroads | $45.94 | 1.22% | 1.28% | $0.140 | 4 | $0.560 | $0.140 | May 29, 2026 | Jun 15, 2026 | $31.80 | $48.03 | 9.7 | 8.0% | 8.7% | 8.4% | 8.4% | 47.0% | 13.6% | $8.15 | 464.0% | 0.0% | -3.1% | 21.6% | $2.49 | 23.7% | 1.0 | 58.0% | 9.6% | 28.2x | 6.3x | 2.08 |
|
| UNP | Contender | Union Pacific Corporation | Industrials | Railroads | $260.71 | 2.12% | 2.15% | $1.380 | 4 | $5.520 | $1.380 | May 29, 2026 | Jun 30, 2026 | $210.84 | $279.70 | 8.9 | 3.0% | 2.0% | 6.8% | 9.6% | 22.4% | 11.9% | $60.75 | 329.0% | 0.0% | 1.1% | 29.2% | $16.03 | 40.7% | 0.9 | 61.0% | 14.8% | 21.5x | 8.0x | 3.14 |
|
| WM | Contender | Waste Management, Inc. | Industrials | Waste Management | $214.76 | 1.76% | 1.46% | $0.945 | 4 | $3.780 | $0.945 | Jun 5, 2026 | Jun 18, 2026 | $194.11 | $248.13 | 11.3 | 12.4% | 9.4% | 9.6% | 8.3% | -4.4% | 11.0% | $34.55 | 522.0% | 0.0% | 14.2% | 11.0% | $15.78 | 29.9% | 0.9 | 69.0% | 8.7% | 31.1x | 8.6x | 2.18 |
|
| KR | Contender | Kroger Company (The) | Consumer Defensive | Grocery Stores | $57.12 | 2.45% | 2.02% | $0.350 | 4 | $1.400 | $0.350 | May 15, 2026 | Jun 1, 2026 | $56.32 | $76.58 | 16.7 | 9.4% | 10.4% | 14.2% | 12.8% | -17.0% | 10.7% | $15.60 | 266.0% | 0.0% | 0.4% | 0.7% | $11.31 | 13.8% | 0.8 | — | 3.4% | 33.4x | 6.2x | 0.55 |
|
| NNN | Champion | NNN REIT, Inc. | Real Estate | REIT – Retail | $45.21 | 5.31% | 5.44% | $0.600 | 4 | $2.400 | $0.600 | Apr 30, 2026 | May 15, 2026 | $38.90 | $46.90 | 8.2 | 3.4% | 2.9% | 2.9% | 3.3% | 18.7% | 10.6% | $10.25 | 341.0% | 0.0% | 6.6% | 41.4% | $3.42 | 8.9% | 0.2 | 52.0% | 4.3% | 22.1x | 2.0x | 4.79 |
|
| PLD | Contender | Prologis, Inc. | Real Estate | REIT – Industrial | $140.97 | 3.04% | 2.89% | $1.070 | 4 | $4.280 | $1.070 | Jun 16, 2026 | Jun 30, 2026 | $103.41 | $150.18 | 14.5 | 5.6% | 7.8% | 11.4% | 9.8% | 41.8% | 10.4% | $19.90 | 608.0% | 0.0% | 8.6% | 44.7% | $5.51 | 6.8% | 0.5 | 39.0% | 4.2% | 35.4x | 2.5x | 109.33 |
|
| CVX | Champion | Chevron Corporation | Energy | Oil & Gas Integrated | $173.77 | 4.10% | 3.93% | $1.780 | 4 | $7.120 | $1.780 | May 19, 2026 | Jun 10, 2026 | $142.40 | $214.71 | 10.1 | 4.5% | 6.0% | 6.0% | 5.0% | 25.9% | 10.3% | $28.75 | 504.0% | 0.0% | -6.8% | 5.8% | $15.70 | 6.6% | 1.1 | 18.0% | 5.2% | 30.2x | 1.9x | 0.70 |
|
| ADC | Challenger | Agree Realty Corporation | Real Estate | REIT – Retail | $73.56 | 3.99% | 4.19% | $0.267 | 11 | $2.937 | $0.267 | Jun 30, 2026 | Jul 15, 2026 | $69.56 | $82.08 | 5.7 | 3.3% | 3.0% | 1.7% | 5.3% | 7.2% | 10.3% | $9.25 | 695.0% | 0.0% | 16.4% | 28.3% | $4.35 | 3.7% | 0.3 | 38.0% | 2.3% | 39.8x | 1.5x | 0.13 |
|
| MA | Contender | Mastercard Incorporated | Financial Services | Credit Services | $492.29 | 0.71% | 0.54% | $0.870 | 4 | $3.480 | $0.870 | Jul 9, 2026 | Aug 7, 2026 | $464.52 | $601.77 | 14.9 | 14.8% | 15.4% | 14.2% | 16.6% | -6.5% | 10.1% | $86.45 | 469.0% | 0.0% | 16.4% | 45.9% | $20.83 | 232.1% | 1.0 | 72.0% | 60.1% | 28.5x | 65.0x | 1.51 |
|
| NEE | Champion | NextEra Energy, Inc. | Utilities | Utilities – Regulated Electric | $87.15 | 2.86% | 2.57% | $0.623 | 4 | $2.492 | $0.623 | Jun 5, 2026 | Jun 15, 2026 | $67.20 | $98.75 | 13.0 | 10.0% | 10.0% | 10.1% | 11.2% | 28.8% | 9.2% | $19.70 | 342.0% | 0.0% | 10.7% | 29.4% | $5.91 | 10.3% | 0.5 | 63.0% | 5.8% | 22.1x | 3.3x | 1.91 |
|
| STAG | Contender | Stag Industrial, Inc. | Real Estate | REIT – Industrial | $38.10 | 11.20% | 3.84% | $0.388 | 11 | $4.268 | $0.124 | Jun 30, 2026 | Jul 15, 2026 | $33.72 | $39.99 | 8.4 | -15.2% | -5.1% | -2.8% | -1.0% | 12.0% | 8.4% | $6.45 | 491.0% | 0.0% | 10.1% | 28.2% | $2.50 | 6.9% | 1.6 | 46.0% | 3.7% | 29.5x | 2.0x | 19.49 |
|
| O | Champion | Realty Income Corporation | Real Estate | REIT – Retail | $60.60 | 5.37% | 5.18% | $0.271 | 12 | $3.252 | $0.271 | Jun 30, 2026 | Jul 15, 2026 | $55.86 | $67.94 | 8.9 | 1.8% | 2.5% | 3.5% | 3.7% | 17.9% | 8.3% | $6.10 | 894.0% | 0.0% | 7.8% | 20.1% | $4.38 | 2.8% | 2.1 | 42.0% | 1.7% | 49.7x | 1.4x | 5.68 |
|
| IIPR | Challenger | Innovative Industrial Propertie | Real Estate | REIT – Industrial | $59.11 | 9.64% | 9.72% | $1.900 | 3 | $5.700 | $1.900 | Jun 30, 2026 | Jul 15, 2026 | $44.58 | $62.30 | 19.3 | 0.0% | 2.1% | 9.7% | — | 33.0% | 8.1% | $19.60 | 202.0% | 0.0% | -13.8% | 43.4% | $6.90 | 6.3% | 0.4 | 14.0% | 5.4% | 15.1x | 0.9x | 1.27 |
|
| TROW | Champion | T. Rowe Price Group, Inc. | Financial Services | Asset Management | $108.69 | 4.78% | 4.59% | $1.300 | 4 | $5.200 | $1.300 | Jun 15, 2026 | Jun 29, 2026 | $85.22 | $118.22 | 10.1 | 2.4% | 2.0% | 5.4% | 9.3% | 28.5% | 7.3% | $46.60 | 133.0% | 0.0% | 4.1% | 27.4% | $9.08 | 18.7% | 5.6 | 4.0% | 18.2% | 11.7x | 2.2x | 13.68 |
|
| COP | Challenger | ConocoPhillips | Energy | Oil & Gas E&P | $108.93 | 3.08% | 3.45% | $0.840 | 4 | $3.360 | $0.840 | May 11, 2026 | Jun 1, 2026 | $85.57 | $135.87 | 17.1 | 5.8% | -15.1% | 14.1% | 5.2% | 22.4% | 6.8% | $29.50 | 269.0% | 0.0% | 8.1% | 12.1% | $14.76 | 11.3% | 1.3 | 26.0% | 8.4% | 18.5x | 2.1x | 0.91 |
|
| HD | Contender | Home Depot, Inc. (The) | Consumer Cyclical | Home Improvement Retail | $329.89 | 2.83% | 2.44% | $2.330 | 4 | $9.320 | $2.330 | Jun 4, 2026 | Jun 18, 2026 | $289.10 | $426.75 | 10.8 | 1.8% | 5.1% | 8.0% | 13.7% | -0.4% | 6.7% | $70.35 | 369.0% | 0.0% | 3.2% | 8.4% | $18.08 | 128.4% | 1.1 | 79.0% | 21.2% | 23.5x | 23.7x | 1.88 |
|
| LMT | Contender | Lockheed Martin Corporation | Industrials | Aerospace & Defense | $496.04 | 2.78% | 2.52% | $3.450 | 4 | $13.800 | $3.450 | Jun 1, 2026 | Jun 26, 2026 | $410.11 | $692.00 | 8.8 | 4.6% | 5.0% | 6.0% | 7.8% | 11.2% | 6.0% | $103.20 | 381.0% | 0.0% | 5.6% | 6.4% | $31.96 | 67.6% | 1.1 | 73.0% | 18.1% | 24.0x | 15.2x | 1.08 |
|
| SWK | King | Stanley Black & Decker, Inc. | Industrials | Tools & Accessories | $87.62 | 3.79% | 3.67% | $0.830 | 4 | $3.320 | $0.830 | Jun 8, 2026 | Jun 23, 2026 | $61.90 | $93.37 | 7.3 | 1.2% | 1.2% | 3.5% | 4.2% | 47.3% | 5.6% | $12.20 | 618.0% | 0.0% | -1.5% | 2.4% | $6.45 | 4.2% | 1.1 | 34.0% | 2.7% | 35.9x | 1.5x | 1.39 |
|
| IEX | Contender | IDEX Corporation | Industrials | Specialty Industrial Machinery | $225.95 | 1.29% | 1.20% | $0.730 | 4 | $2.920 | $0.710 | Jul 6, 2026 | Jul 24, 2026 | $157.25 | $228.26 | 8.3 | 2.9% | 5.4% | 7.0% | 8.2% | 34.2% | 5.4% | $33.85 | 568.0% | 0.0% | 5.8% | 14.4% | $9.17 | 12.8% | 3.4 | 32.0% | 8.6% | 33.4x | 4.2x | 1.92 |
|
| ADM | King | Archer-Daniels-Midland Company | Consumer Defensive | Farm Products | $75.25 | 2.76% | 2.76% | $0.520 | 4 | $2.080 | $0.520 | May 20, 2026 | Jun 10, 2026 | $51.34 | $85.37 | 9.9 | 2.0% | 6.6% | 7.1% | 5.9% | 48.8% | 5.3% | $11.20 | 572.0% | 0.0% | -6.2% | 1.3% | $12.33 | 4.8% | 1.3 | 25.0% | 3.6% | 33.6x | 1.6x | 2.38 |
|
| TGT | King | Target Corporation | Consumer Defensive | Discount Stores | $131.73 | 3.46% | 3.08% | $1.140 | 4 | $4.560 | $1.140 | Aug 12, 2026 | Sep 1, 2026 | $83.44 | $137.87 | 14.3 | 1.8% | 1.8% | 10.9% | 7.4% | 48.9% | 4.8% | $37.85 | 248.0% | 0.0% | -1.7% | 3.2% | $15.42 | 22.0% | 0.9 | 52.0% | 10.1% | 17.4x | 3.7x | 2.43 |
|
| MSFT | Contender | Microsoft Corporation | Technology | Software – Infrastructure | $373.98 | 0.97% | 0.76% | $0.910 | 4 | $3.640 | $0.910 | Aug 20, 2026 | Sep 10, 2026 | $356.28 | $555.45 | 11.2 | 9.9% | 10.2% | 10.2% | 9.9% | -20.3% | 4.4% | $84.05 | 345.0% | 0.0% | 14.9% | 39.3% | $22.90 | 34.0% | 1.3 | 10.0% | 29.1% | 22.3x | 6.7x | 1.17 |
|
| MRK | Contender | Merck & Company, Inc. | Healthcare | Drug Manufacturers – General | $113.26 | 3.00% | 2.92% | $0.850 | 4 | $3.400 | $0.850 | Jun 15, 2026 | Jul 8, 2026 | $76.66 | $125.14 | 9.3 | 5.0% | 5.3% | 6.3% | 6.8% | 52.4% | 4.0% | $17.75 | 538.0% | 0.0% | 1.3% | 13.6% | $7.24 | 18.9% | 1.3 | 50.0% | 9.8% | 31.9x | 6.1x | 5.30 |
|
| PG | King | Procter & Gamble Company (The) | Consumer Defensive | Household & Personal Products | $150.60 | 2.89% | 2.43% | $1.089 | 4 | $4.356 | $1.057 | Apr 24, 2026 | May 15, 2026 | $137.62 | $167.25 | 8.5 | 4.5% | 5.0% | 5.6% | 4.8% | 0.2% | 3.7% | $34.20 | 340.0% | 0.0% | 0.3% | 19.2% | $8.34 | 31.1% | 0.7 | 31.0% | 21.5% | 22.0x | 6.5x | 4.22 |
|
| SBUX | Contender | Starbucks Corporation | Consumer Cyclical | Restaurants | $101.00 | 2.46% | 2.28% | $0.620 | 4 | $2.480 | $0.620 | May 15, 2026 | May 29, 2026 | $77.99 | $108.88 | 9.5 | 2.9% | 5.9% | 7.0% | 12.5% | 14.0% | 3.4% | $6.55 | 1,442.0% | 0.0% | 2.8% | 3.9% | $3.81 | — | 0.9 | 1.7% | 10.3% | 77.1x | —x | 1.34 |
|
| ADP | King | Automatic Data Processing, Inc. | Technology | Software – Application | $250.09 | 2.72% | 2.11% | $1.700 | 4 | $6.800 | $1.700 | Jun 12, 2026 | Jul 1, 2026 | $188.16 | $315.98 | 15.1 | 10.3% | 11.5% | 12.4% | 12.3% | -14.5% | 3.2% | $53.65 | 366.0% | 0.0% | 7.1% | 20.1% | $13.64 | 71.2% | 1.0 | 40.0% | 40.9% | 23.3x | 15.8x | 2.34 |
|
| AMT | Contender | American Tower Corporation (REI | Real Estate | REIT – Specialty | $176.13 | 4.07% | 3.14% | $1.790 | 4 | $7.160 | $1.790 | Jun 12, 2026 | Jul 13, 2026 | $165.08 | $234.33 | 11.6 | 5.1% | 4.3% | 7.5% | 13.4% | -12.6% | 2.9% | $31.00 | 468.0% | 0.0% | 5.1% | 26.8% | $11.95 | 30.0% | 0.3 | 92.0% | 6.5% | 28.4x | 23.3x | 1.85 |
|
| VICI | Challenger | VICI Properties Inc. | Real Estate | REIT – Diversified | $26.35 | 6.83% | 5.59% | $0.450 | 4 | $1.800 | $0.450 | Jun 18, 2026 | Jul 9, 2026 | $26.27 | $34.01 | 13.8 | 3.9% | 4.9% | 6.9% | — | -7.1% | 2.4% | $14.60 | 80.0% | 0.0% | 4.1% | 76.8% | $2.37 | 11.3% | 11.1 | 39.0% | 6.8% | 9.0x | 1.0x | 6.54 |
|
| MCD | King | McDonald's Corporation | Consumer Cyclical | Restaurants | $274.37 | 2.71% | 2.19% | $1.860 | 4 | $7.440 | $1.860 | Jun 2, 2026 | Jun 16, 2026 | $271.85 | $341.75 | 10.2 | 5.3% | 7.4% | 7.5% | 7.6% | 0.4% | 1.0% | $60.60 | 353.0% | 0.0% | 3.7% | 31.6% | $14.83 | — | 1.1 | 1.0% | 16.7% | 22.6x | —x | 2.56 |
|
| MDT | Champion | Medtronic plc. | Healthcare | Medical Devices | $78.63 | 3.61% | 2.91% | $0.710 | 4 | $2.840 | $0.710 | Jun 26, 2026 | Jul 17, 2026 | $73.31 | $106.33 | 7.7 | 1.4% | -5.9% | 4.1% | 6.5% | -2.6% | 0.6% | $18.65 | 322.0% | 0.0% | 8.3% | 13.2% | $5.73 | 9.8% | 2.1 | 35.0% | 6.3% | 21.1x | 2.1x | 1.57 |
|
| DVN | Challenger | Devon Energy Corporation | Energy | Oil & Gas E&P | $42.51 | 3.01% | 4.72% | $0.320 | 4 | $1.280 | $0.240 | Jun 15, 2026 | Jun 30, 2026 | $31.45 | $52.71 | 1.5 | -8.8% | -38.7% | -1.5% | 2.9% | 30.3% | 0.4% | $17.95 | 137.0% | 0.0% | 7.8% | 13.7% | $5.57 | 15.2% | 1.0 | 33.0% | 9.8% | 11.8x | 1.7x | 2.92 |
|
| BMY | Contender | Bristol-Myers Squibb Company | Healthcare | Drug Manufacturers – General | $54.37 | 4.63% | 4.05% | $0.630 | 4 | $2.520 | $0.630 | Jul 2, 2026 | Aug 3, 2026 | $42.52 | $62.89 | 10.5 | 2.5% | 4.0% | 5.9% | 5.2% | 27.4% | 0.0% | $17.85 | 205.0% | 0.0% | -0.2% | 15.0% | $6.52 | 38.7% | 1.4 | 69.0% | 11.4% | 15.2x | 5.5x | 171.16 |
|
| HPQ | Contender | HP Inc. | Technology | Computer Hardware | $24.08 | 4.98% | 3.73% | $0.300 | 4 | $1.200 | $0.300 | Sep 9, 2026 | Oct 7, 2026 | $17.56 | $29.65 | 14.4 | 4.0% | 4.6% | 9.4% | 10.2% | 10.2% | -1.4% | $13.50 | 78.0% | 0.0% | 3.2% | 4.5% | $5.02 | — | 0.8 | 1.0% | 28.1% | 8.9x | —x | 19.58 |
|
| UNH | Contender | UnitedHealth Group Incorporated | Healthcare | Healthcare Plans | $404.93 | 2.29% | 1.67% | $2.320 | 4 | $9.280 | $2.210 | Jun 15, 2026 | Jun 23, 2026 | $234.60 | $415.98 | 13.8 | 5.2% | 9.4% | 11.5% | 15.5% | 40.7% | -2.8% | $66.35 | 510.0% | 0.0% | 11.8% | 2.7% | $25.49 | 12.2% | 0.8 | 42.0% | 7.2% | 30.5x | 3.8x | 1.39 |
|
| MDLZ | Contender | Mondelez International, Inc. | Consumer Defensive | Confectioners | $60.13 | 2.49% | 2.38% | $0.500 | 3 | $1.500 | $0.500 | Jun 30, 2026 | Jul 14, 2026 | $51.20 | $71.15 | 12.4 | 7.4% | 9.4% | 9.9% | 11.6% | -6.1% | -2.9% | $10.10 | 495.0% | 0.0% | 5.8% | 6.6% | $3.03 | 10.2% | 0.5 | 38.0% | 6.0% | 29.8x | 3.0x | 0.99 |
|
| KMB | King | Kimberly-Clark Corporation | Consumer Defensive | Household & Personal Products | $102.84 | 4.98% | 3.78% | $1.280 | 4 | $5.120 | $1.280 | Jun 5, 2026 | Jul 2, 2026 | $92.42 | $137.46 | 7.8 | 2.4% | 2.8% | 2.8% | 3.5% | -11.8% | -4.0% | $25.85 | 298.0% | 0.0% | -18.0% | 12.8% | $9.63 | 111.7% | 0.8 | 78.0% | 26.7% | 19.9x | 19.0x | 2.07 |
|
| ABT | Contender | Abbott Laboratories | Healthcare | Medical Devices | $87.64 | 2.88% | 1.80% | $0.630 | 4 | $2.520 | $0.630 | Jul 15, 2026 | Aug 17, 2026 | $81.97 | $139.06 | 11.4 | 7.0% | 7.6% | 8.5% | 9.3% | -30.9% | -4.0% | $17.85 | 391.0% | 0.0% | 5.7% | 13.9% | $5.43 | 12.3% | 1.4 | 36.0% | 9.3% | 24.6x | 2.9x | 1.31 |
|
| PEP | King | Pepsico, Inc. | Consumer Defensive | Beverages – Non-Alcoholic | $142.33 | 4.16% | 3.10% | $1.480 | 4 | $5.920 | $1.423 | Jun 5, 2026 | Jun 30, 2026 | $127.60 | $171.48 | 10.9 | 4.8% | 6.8% | 6.8% | 7.2% | 19.3% | -4.3% | $31.90 | 346.0% | 0.0% | 2.3% | 9.2% | $9.59 | 43.9% | 0.9 | 67.0% | 14.1% | 22.3x | 9.1x | 1.53 |
|
| LYB | Contender | LyondellBasell Industries NV | Basic Materials | Specialty Chemicals | $58.39 | 4.73% | 7.69% | $0.690 | 4 | $2.760 | $0.690 | Jun 1, 2026 | Jun 8, 2026 | $41.58 | $83.94 | 4.0 | -23.6% | -5.1% | -0.8% | 2.6% | 15.4% | -4.8% | $9.30 | 528.0% | 0.0% | -25.2% | -2.7% | $7.97 | -6.0% | 1.5 | 56.0% | -3.4% | —x | 1.9x | 1.53 |
|
| AES | Contender | The AES Corporation | Utilities | Utilities – Diversified | $14.65 | 4.81% | 3.97% | $0.176 | 4 | $0.704 | $0.176 | May 1, 2026 | May 15, 2026 | $10.02 | $17.65 | 8.5 | 0.9% | 2.8% | 3.7% | 5.3% | 55.1% | -5.4% | $9.60 | 53.0% | 0.0% | -0.4% | 5.1% | $6.96 | 5.3% | 0.7 | 86.0% | 2.1% | 7.6x | 2.4x | 0.81 |
|
| PFE | Contender | Pfizer, Inc. | Healthcare | Drug Manufacturers – General | $25.03 | 6.87% | 5.38% | $0.430 | 4 | $1.720 | $0.430 | May 8, 2026 | Jun 12, 2026 | $23.11 | $28.75 | 9.6 | 1.2% | 2.0% | 2.8% | 4.6% | 19.4% | -5.9% | $6.55 | 282.0% | 0.0% | -1.7% | 11.8% | $2.10 | 8.3% | 1.3 | 40.0% | 5.1% | 19.1x | 1.6x | 13.77 |
|
| INFY | Challenger | Infosys Limited | Technology | Information Technology Services | $10.89 | 4.76% | 2.75% | $0.259 | 2 | $0.518 | $0.259 | Jun 10, 2026 | Nov 12, 2025 | $10.46 | $30.00 | 12.1 | 2.2% | 7.8% | 7.3% | 10.9% | -33.1% | -6.8% | $4.00 | 172.0% | 0.0% | 9.6% | 16.5% | $1.00 | 31.4% | 2.0 | 6.0% | 2,654.1% | 13.6x | 9.0x | 1.87 |
|
| UPS | Contender | United Parcel Service, Inc. | Industrials | Integrated Freight & Logistics | $107.59 | 6.10% | 4.77% | $1.640 | 4 | $6.560 | $1.640 | May 18, 2026 | Jun 4, 2026 | $82.00 | $122.41 | 16.2 | 0.3% | 1.5% | 10.1% | 8.1% | 22.9% | -7.7% | $30.90 | 248.0% | 0.0% | -2.7% | 5.9% | $11.19 | 33.4% | 1.2 | 63.0% | 12.2% | 17.4x | 5.6x | 1.65 |
|
| HSY | Contender | The Hershey Company | Consumer Defensive | Confectioners | $169.99 | 3.42% | 2.39% | $1.452 | 4 | $5.808 | $1.452 | May 15, 2026 | Jun 15, 2026 | $160.07 | $239.48 | 15.3 | 3.0% | 10.8% | 11.9% | 9.2% | 5.5% | -9.7% | $26.85 | 533.0% | 0.0% | 4.4% | 9.1% | $15.85 | 23.2% | 1.2 | 51.0% | 11.3% | 31.7x | 7.3x | 0.99 |
|
| CMCSA | Contender | Comcast Corporation | Communication Services | Telecom Services | $22.52 | 5.86% | 3.08% | $0.330 | 4 | $1.320 | $0.330 | Jul 1, 2026 | Jul 22, 2026 | $22.13 | $34.36 | 13.6 | 8.3% | 7.4% | 7.7% | 10.3% | -23.2% | -11.5% | $25.50 | -12.0% | 0.0% | 0.0% | 15.0% | $9.05 | 20.9% | 0.9 | 50.0% | 10.0% | 4.4x | 0.9x | 142.98 |
|
| GIS | Challenger | General Mills, Inc. | Consumer Defensive | Packaged Foods | $33.67 | 7.25% | 3.67% | $0.610 | 4 | $2.440 | $0.610 | Apr 10, 2026 | May 1, 2026 | $31.75 | $54.18 | 11.1 | 1.7% | 4.1% | 3.9% | 3.2% | -28.0% | -20.4% | $20.45 | 65.0% | 0.0% | -1.9% | 12.1% | $4.17 | 23.6% | 0.6 | 54.0% | 10.3% | 8.2x | 3.3x | 11.74 |
|
| NKE | Contender | Nike, Inc. | Consumer Cyclical | Footwear & Accessories | $44.01 | 3.73% | 1.63% | $0.410 | 4 | $1.640 | $0.410 | Jun 1, 2026 | Jul 1, 2026 | $41.35 | $80.17 | 12.5 | 3.8% | 7.1% | 8.8% | 10.1% | -21.6% | -24.0% | $7.60 | 479.0% | 0.0% | -9.8% | 4.8% | $1.41 | 16.0% | 2.1 | 41.0% | 9.4% | 29.0x | 4.6x | 1.58 |
|
| ACN | Contender | Accenture plc | Technology | Information Technology Services | $124.19 | 3.94% | 1.40% | $1.630 | 3 | $4.890 | $1.480 | Apr 9, 2026 | Aug 14, 2026 | $123.13 | $307.77 | 1.9 | -45.7% | -10.4% | -2.0% | 3.5% | -54.8% | -24.3% | $62.60 | 98.0% | 0.0% | 7.4% | 10.7% | $21.54 | 24.4% | 1.3 | 19.0% | 20.1% | 9.9x | 2.4x | 0.90 |
Calculators
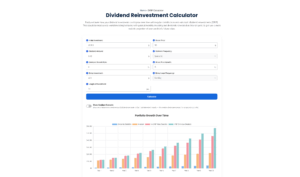
Dividend ETF Calculators
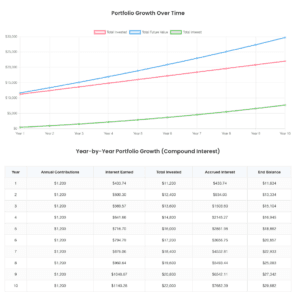
Get started with DRIP investing using our calculators. Fill in the information, and it will show you dividend returns.
For beginners
Getting started
Starting with DRIP investing is simple. It’s about making small, regular investments grow over time, just like how Coca-Cola started. Here, we’ll explain the easy steps from your first dividend to picking a DRIP plan that fits you. Let’s get those dividends to build up your savings.


Participating in the DRIP
Generally, there are three ways investors can participate in dividend reinvestment plans: company-run plans, transfer agent plans, and brokerage plans
Company run plans
Many companies run these programs through their investor relations or shareholder services departments. Several companies have even started to offer Individual Retirement Accounts in addition to their reinvestment plans.
Companies may have participation rules that include owning at least one share prior to joining the dividend reinvestment plan. They may also require the stock to be in the investor’s name rather than street name.
A phone call to the shareholder services department is an effective way to learn about company-specific participation rules.
Transfer agent plans
Due to the overwhelming popularity of some DRIPs, companies may engage the help of transfer agents to administer their programs. The transfer agent is a third-party broker that typically runs plans for many different companies.
Since the transfer agent is running multiple programs using the same resources, they can do it more cost-effectively than some of the issuing companies.
Some of the larger transfer agents include American Stock Transfer & Trust Company, Mellon Investor Services, and ComputerShare.
Brokerage plans
While dividend reinvestment programs reduce the fees collected by traditional brokerage houses, many of these firms now attempt to mirror DRIPs by offering the ability to reinvest dividends without charging a fee.
Unfortunately, these plans usually lack the most attractive feature of a real DRIP: The cash purchase of new shares of stock without fees.
More on DRIP brokersStrategies
Dividend investing strategies
Learn about Dividend Investing Strategies in a way that’s easy to understand. This section will show you how to pick good stocks that pay dividends and make a plan to earn regular income from them. Get ready to grow your money smarter.


dividend champions
Future dividend champions
Meet the Future Dividend Champions. These companies are on track to becoming top picks for investors who love getting regular dividend payments. In this section, we’ll show you why these stocks stand out and how they could help give your investments a boost over time. Start exploring which one might be the champion for your portfolio.


3000+
Downloads
20+
Years in drip investing
stay updated
Dividend champions spreadsheet
Dividend champions are companies that have consistently raised their dividends each year for multiple years in a row.
Use our Dividend Champions spreadsheet for the latest list of dividend champions, contenders, and challengers.
Updated monthly on the 1st.
Download nowresources & tools
Resources for the dividend investor
Fill your investor’s toolbox with our handpicked list of easy-to-read books. If you’re just starting or already know a lot about investing, these books are full of tips and advice to help you make money with dividends. Check out our favorites and learn new ways to improve your investments.


For experts
Deep dive into drip investing
Dive into the world of dividend reinvestment. Find out how to pick stocks that can grow your money and learn easy ways to save on taxes. These articles will help you understand how to make smart choices for building your investments over time.


NEWS
Recent Dividend News
Stay in the know with our dividend and DRIP news. We cover everything from stock predictions, to company performance, investment insights, ETFs and more.

as seen on
DripInvesting on the web


“THANK YOU SO MUCH FOR THIS.
How the heck did i not know this existed?!
A huge thank you to the creator(s) and editor(s) of this document!”

u/LordGuardial
“This is awesome!
I started with dripinvesting.org when I first started really focusing on dividends.
Thank you for sharing.”

u/pinetree64
