Stock Rover is software that I recommend and I use regularly. From the perspective of a dividend investor, I find that it gives me valuable information when tracking my portfolio and considering new investments. I am offering a quick overview of this very complete program so that you can decide for yourself whether or not it fits your personal needs.
This website and blog have an affiliate relationship with Stock Rover, so I thought that I would get that out in the open. This means that if you send them money, a portion benefits this website.
This is important to know when reading an article because it is common for a website to offer a swath of affiliate products in the hopes that you will buy one or more. In this particular case, I offer one, and I offer it because I believe in it and use it regularly. If I did not use it myself, I would not have it as an affiliate product. Period.
Start with Interactive Brokers
Discussing Stock Rover is like discussing Photoshop, as the author needs to explain their requirements for the software, then needs to explain how it is used to fulfill those requirements. By necessity, this leaves out many of the features that may be of interest to others.
I have used Photoshop since 1995 when I found a demo disk in a library book, and to this date have every installation and update disk since version 4.0 (I stopped buying when they decided to move to a subscription service).
I mention this because I have taught Photoshop and the software is so comprehensive that the initial class always consisted of asking people what they were looking to get out of the software so that I could formulate the training to concentrate on those aspects. That is how I feel about Stock Rover.
I can explain some things that, as a dividend investor, I utilize, but also realize that it can do so much more than the few things I offer in this article.
I have certainly not tested every similar piece of software. I have looked at a number of them, but when I started using Stock Rover, I saw no need to continue searching, as it had the solution I had been seeking. What I had sought was a program that tracked the companies I owned, gave me information about companies I was considering, and offered some screening options. This gives me all three.
Stock Rover offers a free plan as well as three paid plans. I will cover the top end Premium Plus plan, though depending upon your needs, you may not need all of its features.
The Dashboard
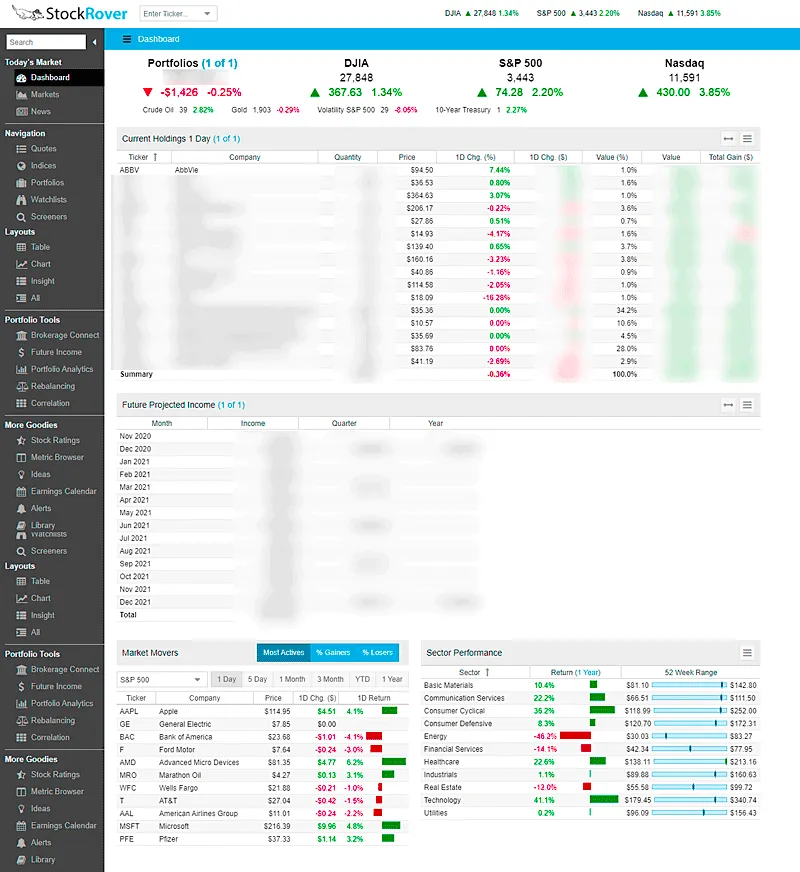
Once logged in, one returns to where they left off at their end of the last session. The Dashboard is a convenient one-stop-shop to get information. A view with my current holdings are at the top of the screen, as it gives me a total value and weighting of each of the holdings. The day in the example above was 4 November, and the thing that jumped out at me was the fact that while it was a day of big gains, my portfolio actually lost a small amount due to one stock getting hammered.
As I am retired and want to have dividends pay the bills once I start taking Social Security, I place Future Projected Income in the second slot. This projects on a monthly, quarterly, and yearly basis, the amounts that I should expect to receive through dividends. There is also another section that breaks this information down to a more granular level.
The panel is followed by Market Movers and Sector Performance, which can be configured to reflect multiple timeframes. It is helpful when looking to see which sectors are undergoing difficulties and determine where bargains may be found.
Market News, Portfolio Charting, and Portfolio Performance are also available for inclusion in this area, I am just not interested in them.
The Companies I Own

By clicking on the Portfolios link (under Navigation) and choosing Table (under Layouts), I can see information about my portfolio. On the screenshot, the price, quantity, cost per share, basis, value, weighting, yield, and expected yearly dividends are shown.
That is nice and convenient, but there is more to this than meets the eye. For instance, the first company in the blurred out version of the screenshot above is AbbVie. If I highlight the first row and hover over Dividend Yield, an arrow gives me additional options. One is Historical Data, which offers a table that displays the Price and Dividend Yield going back ten years (actually, for AbbVie, it shows eight years because it has only been around that long).
There are other possibilities in that selection, which I will not go into, but they help organize and display the information in a way should be useful to those with large portfolios.
What is seen above is an example of the Portfolio Performance view. There are other views available, like Profile, Dividends, Cash Flow, Valuation, Fair Value, Balance Sheet, and on and on and on. In all, there are 22 separate views.
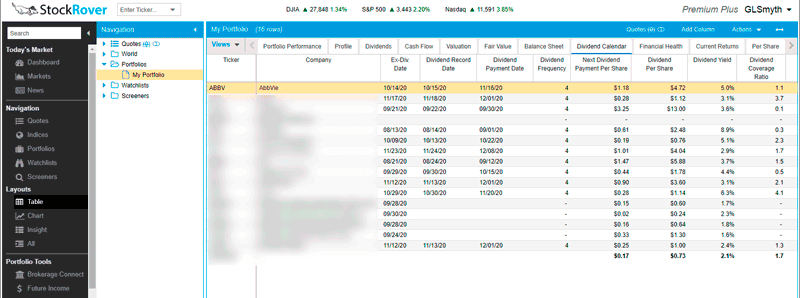
The Dividend Calendar shows the all-important Ex-Div Date and, as you can see, a whole lot more (and as you cannot see, there are enough columns here that if I wanted to display them all, the table would reach into my other computer screen. As the Ex-Div Date is important to me, I have moved the column so that it is next to the company name, as the order of these columns is configurable.
I am glad that this is not an extensive review so that I do not have to go through all 22 views. I should note that it covers not only stocks, but also mutual funds. I have retirement funds sitting in accounts at Vanguard and Fidelity, and the ability to include them in the listing gives me a complete picture.
The Companies I Am Considering
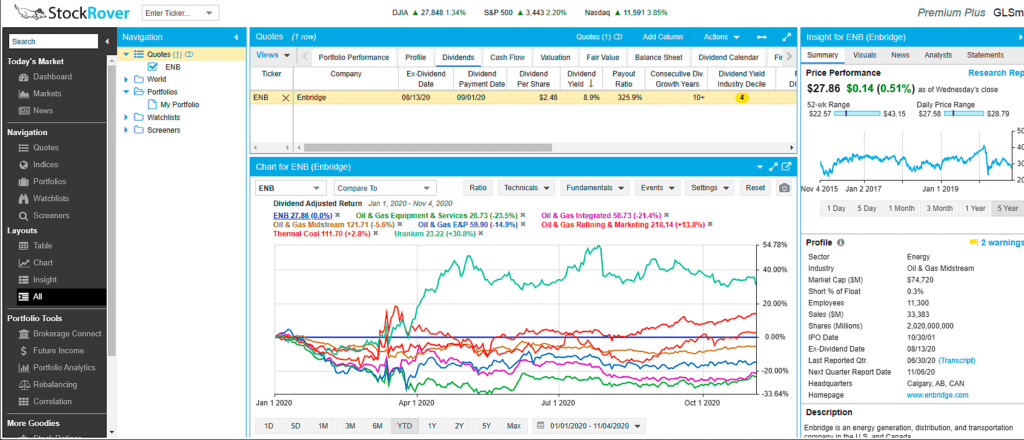
In a previous article, I profiled Enbridge as it was on the cusp of becoming a Dividend Champion. My first stop was to go to Stock Rover and enter its ticker into the Quotes section. This displays three layouts, which are helpful.
The Table layout offers all of the aforementioned 22 views. Below is a Chart view. I wanted to compare Enbridge against several other things, so I added them to the chart and selected ENB. This made ENB’s performance a straight line, and all comparisons fell above or below it during the selected timeline. Quite handy.
On the right, the Insight view offers numerous options, with the Summary displayed above. Visuals offer an option to see Dividends, Earnings, Monthly Returns, and a plethora of other choices. Also available is News, Analyst opinions, and links to the company’s annual reports.
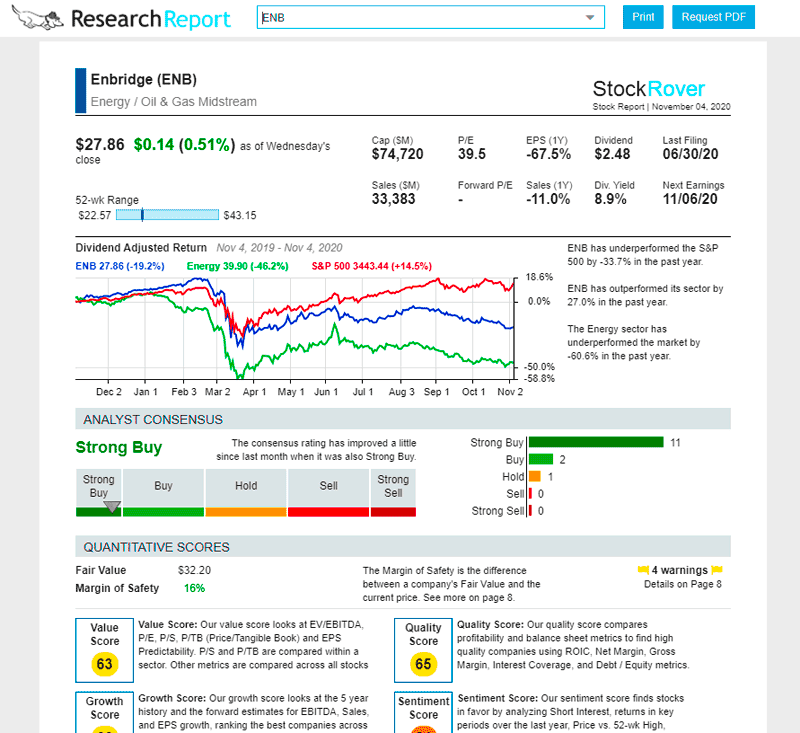
Perhaps the coolest thing here is the awesome Research Report. This is where a boatload of relevant information is assembled and put in one place. It can be viewed online, saved as a PDF, or printed out (I like doing that so I can write notes on the paper – yes, still old school). Over the course of about eight pages, an enormous amount of information is compactly and conveniently displayed. An example can be found here.
The Screening Options
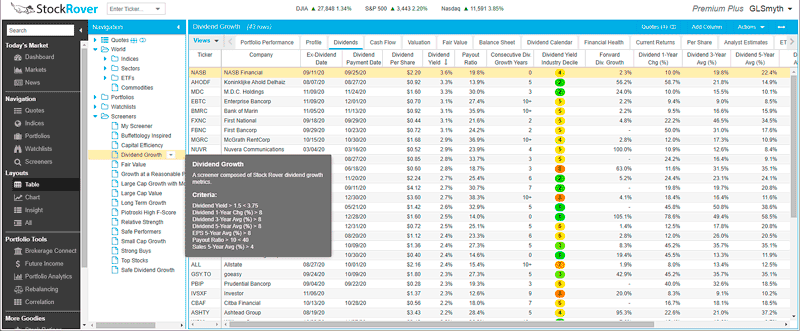
Stock Rover comes with a bunch of screens ready to go. I created my own Dividend Growth screen, which displays metrics such as Dividend Yield, Dividend Growth, Payout Ratio, and others. Selected companies can then be examined through all of the elements available via table view.
When creating a screen, there are many metrics available – over 550 of them. They are organized within 29 folders if you do not want to see all of them in a long list. To date, there have not been any that I have felt I needed outside those available.
If you do not want to create your own screen, there is a library of too many screens to count, so you will never run out of ideas.
In addition to Screeners are Watchlists. These are lists that are populated with Dividend Champions, Aristocrats, and Kings, Sector ETFs, and even Wind Energy and Cloud Computing. As with the Screeners, you have access to all of the table view elements, and you can create your own Watchlists.
Finishing Up
Just as I had to leave out much of Photoshop’s capabilities when I was teaching a twelve-session course, so is the case with Stock Rover. There is so much to it that it is not possible, nor is it reasonable, to offer a complete overview. I have but quickly glossed over a number of features that interest this dividend investor.
Just to put an exclamation point to this, Stock Rover was named as “Best of the Web” in the American Association of Individual Investors Computerized Investing 2020 Best of the Web awards. It was cited in two separate categories, Stock Screening and Stock Research and Data. Stock Rover also received an honorable mention in the Portfolio Tracking and Optimization category.
Stock Rover fills all of my investing tracking and research needs, and along with my Dividend Spreadsheet, which I have customized for my own use, forms a complete package of portfolio tracking and initial research to find companies that fit my portfolio.
My suggestion is that if you think that this software might be helpful, you should take a look at Stock Rover to see if it fits your needs.
