The Dividend Discount Model is a means of valuing a stock price that is relevant to dividend investors because the theory is based on the sum of all of the stock’s future dividend payments. This article explains the formula and its shortcomings, as well as means to fixing those shortcomings and adding a margin of safety.
There are as many ways to evaluate stocks as there are notes on a piano – perhaps more – some better than others, some completely worthless. There is one, however, that is primarily geared toward dividend growth stocks and that is the Dividend Discount Model (DDM).
This theory contends that a dividend stock is worth the discounted value of all dividend payments going into the future. There is a bit more than initially meets the eye in that sentence so I will break it down.
Start with Interactive Brokers
“Life can only be understood backwards—but it must be lived forwards”
I have used this quote from Kierkegaard in the past and will almost certainly use it again because it is relevant to not only investing but also many other things in our life. We can look into the past to build a model explaining events, but going into the future we cannot avoid the requirement of making a list of assumptions.
The DDM is no different. Reasonable assumptions must be made when attempting to divine behavior that may or may not subsequently occur. This involves a degree of risk, which can be mitigated through conservative estimations or augmented by stretching the premises. We all have personal risk levels, so it is important to understand where one’s level of comfort lies, and that should be kept in mind when considering this model.
The Dividend Discount Model is a derivation of the Discounted Cash Flow valuation method, which bases enterprise value on future cash flows. The DDM one of the most conservative methods derived from this, and the most straightforward of these methods is called the Gordon Growth Model, which is what we will be examining.
Diving Into the Theory
To begin I will refer to the loaded word used above in the sentence that defines the model, which is “discounted”. Understandably, the value of a dividend stock might be worth all future dividends that are received, but the word “discounted” was used, which somewhat changes the picture. The bottom line is that $1 a year from now is worth less than $1 right now. Allow me to explain.
As an example let’s say that a friend asks you to loan them $100, which they will pay back in one year. One year passes and they return the $100, so all is well, except for the fact that you know that you could have placed that $100 in a savings account that offered 5% interest (sure, not possible these days, but let’s make the math easy). Whereas you could have had $105 from that Franklin note you now only have $100, so the $100 a year ago was worth more than it is today.
This is the idea of the term “discounted”, the suggestion that future dividends are not worth as much as current dividends, and the further into the future those monies are, the less valuable they are.
If a company offers a $1 dividend per share right now, that $1 might only be worth $0.95 a year from now ($0.95 * 1.05 = $1), and $0.91 two years from now, $0.86 the following year, and so on. Adding all of these discounted values going into the future yields the value of the stock if we are assuming that it is worth the sum of all future discounted dividends.
The below chart extends this example to 50 years.
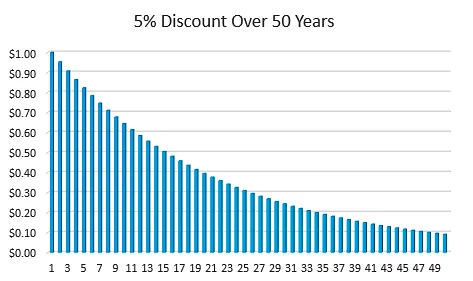
Adding all future dividends of this example together comes to $19.17, in case anyone is interested. Also, in case there is interest, in this example, year 100 eventually rounds to $0.
This, however, is one of the reasons why dividend growth is so important. If a company raises its dividend by about 5% every year then that would cover the discount in the example above, allowing for a future dollar to be worth a current dollar.
The Formula
If you wish you may go the route of the scary formula:
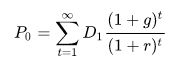
Fortunately for us, it can be whittled down to something more manageable:
P = D1 / (r – g) - P is the fair price of the stock
- D1 is next year’s expected dividend
- r is the discount rate or required rate of return
- g is the dividend growth rate.
We can plug some example numbers into the formula to see how this works.
We see that a company is selling at $15 per share and are contemplating a purchase. They currently offer an annual dividend of $0.95 and expect to increase it next year to $1 per share, and that will steadily grow 5% year over year. We have a requirement to make 10% on our money because we know that we can make that elsewhere, so this would be the discount rate. The question is whether or not that other place would offer a better investment than this company’s current valuation.
Entering values into the right side of the formula offers:
- D1 = next year’s expected dividend = $1
- r = discount rate or required rate of return = 10%
- g = dividend growth rate = 5%
$1 / (10% – 5%) = $1 / 0.05 = $20.00The $20 result is the proper value of the stock according to the DDM. As it is higher than the current $15 value of the stock this indicates that the stock is underpriced by $5 and would offer a better value to the investor.
Note that the dividend growth rate is subtracted from the required rate of return. If the former is larger than the latter then mathematically and logically we are done – mathematically in the respect that the result will be negative and a stock cannot have a negative value, and logically in the respect that if the growth rate is more than is required then the investment is proper.
Shortcomings
Of course, nothing is this easy – sure the math is easy but as is the case with anything looking into the future, complications exist.
For one, this formula is primarily suited for companies that have long-term stable growth. High-growth stocks can post a problem with this model if the company’s growth rate exceeds the expected rate of return. With this happening then the denominator will result in a negative value, resulting in a negative amount. This is meaningless, as noted above.
Another difficulty concerns the input of the values, or in the common lingo – garbage in, garbage out. We are assuming a constant dividend growth rate and companies do not do this. I grabbed a copy of the Dividend Champions spreadsheet and looking through over 800 companies saw none that had the same 3, 5, and 10-year growth rates. There will always be some variation in this number.
The 800+ companies in this list are the best case examples, as they have a history of dividend growth. Those without at least a handful of years of consistent dividend growth will offer extreme difficulty in determining realistic numbers that can be placed into this formula.
An additional issue comes with the discount rate. If you know what percentage increase you require then this is not a problem at all. Perhaps you have an opportunity to safely invest somewhere that offers a fixed return and you are trying to decide between placing your money there or with a particular stock. In that case, you know the discount rate.
However, if you are just guessing what the discount rate should be then you may as well not bother in the first place. After all, if you select a discount rate that is too low then everything will look good and if you select one that is too high then nothing will qualify.
Attempting to Fix the Shortcomings
The Capital Asset Pricing Model describes the relationship between systemic risk and expected return for assets, especially for stocks. Investors expect to be paid to take risk and the CAPM takes this into account. The formula is:
Ri = Rf + (β * (Rm – Rf)) No need to get freaked out by the β symbol, it is merely a variable. Here are what the placeholders mean.
- Ri = Return on asset (which will become the discount rate)
- Rf = Return on risk-free asset
- β = Beta
- Rm = Market return
To expand:
- Rf – is the return of something very safe, like a treasury note or savings account
- β – is beta and may be thought of, as Investopedia suggests, “the covariance of the return of an asset with the return of the benchmark divided by the variance of the return of the benchmark” … or simply, a number that indicates how the security fluctuates when compared to something like the S&P 500. A value of 1 means that when the S&P 500 goes up or down, the stock moves in the same direction the same amount. A value over 1 indicates that when the S&P 500 moves in a direction the stock moves even more so in that direction, a value under 1 means that it moves less in that direction.
- Rm – is the annualized return of the market
Getting this information is not difficult. The yield on a 10 year Treasury note would be a reasonable value to use as a risk-free asset. The yield as of this writing is a very low 0.64% – current rates are found here.
The beta (β) of a stock may be found on Yahoo Finance. For instance, the current beta of National Fuel Gas (NFG), a company I own, is 0.66 and is found here next to “Beta (5Y Monthly)”.
The annualized return on the market may be found at DQYDJ. I selected the 5, 10, 20, and 30 year periods to create the following table.
| Length of Investment | 5 Years | 10 Years | 20 Years | 30 Years |
|---|---|---|---|---|
| Average Return | 7.10% | 6.82% | 6.65% | 6.63% |
At this point, I will use the 20-year value, as it includes two complete business cycles, from the Dot-com bubble to recovery to the banking collapse of 2008 to recovery.
Putting these values together for NFG, we get:
Ri = Rf + (β * (Rm – Rf))- Rf = Return on risk-free asset = 0.64%
- β = Beta = 0.66
- Rm = Market return = 6.65%
Ri = 0.64% + 0.66 (6.65% – 0.64%) = 0.64% + (0.66 6.01%) = 0.64% + 3.97% = 4.61%4.61% would be a reasonable discount rate to use when evaluating NFG. Let’s complete the calculations using the formula from the Dividend Discount Model.
P = D1 / (r – g) National Fuel Gas has consistently increased its quarterly dividend by $0.01 over the past five years so I will assume that their current quarterly dividend of $0.435 will become $0.445 next year, or $1.78 annual dividend.
According to the Dividend Champions spreadsheet NFG’s dividend growth has been remarkably consistent over the years. Their 3, 5, and 10-year growth rates have been 2.4, 2.5, and 2.7%. I will work with the 2.4% value.
P = $1.78 / (4.61% – 2.4%) = $1.78 / 0.021 = $80.54 Adding a Margin of Safety
“Confronted with a challenge to distill the secret of sound investment into three words, we venture the motto, MARGIN OF SAFETY.”Benjamin Graham – The Intelligent Investor
Long ago I heard advice concerning when to arrive at an appointed meeting – one should always be early. Being late shows disrespect to the other’s time. Being exactly on time is almost impossible – even in those rare cases when the timing is perfect one person’s watch might not match the other’s. Always being early means never being late.
So it is for the margin of safety. Margin of safety is so important that Benjamin Graham devoted an entire chapter to this topic (Chapter 20) in his seminal book, The Intelligent Investor. Warren Buffett has said that that is one of his two favorite chapters of the book, so all investors should be well versed in its importance.
Buying a company above its value makes no sense to the prudent investor. Purchasing at exactly the company’s value is impossible. The key is to purchase below the company’s value, but the real question is how much margin of safety should be employed.
The larger the margin of safety, the more confidence one will have that the purchase will be judicious if one or more of the underlying assumptions proves to be incorrect. Think of the guesses that have been made to fulfill the above calculations. Albeit informed, I made assumptions about market return, dividend growth rate, and next year’s dividend, so a deviation from any of those will affect the calculations.
I like to use 20% as a very general rule of thumb, but I also must admit that I have no idea where I came up with that number. The number also gets a bit juggled depending upon circumstances. For instance, if I am looking at a utility then my confidence might allow me to accept 10% as a valid number, if I am seeking something more speculative then 33-50% might allow me to find a comfort level.
The key here is to have a plan and stick with it. Removing emotion from valuation is sometimes easier said than done, so I suggest one to require a higher margin of safety in the earlier stages of their investing career, then allow the percentage to be lowered as confidence is built with successful purchases.
For this demonstration I will assume a 20% margin of safety, so $80.54 * 0.8 = $64.43.
According to our calculations, if the company’s shares are available for less than $64.43 then a purchase should be considered. At this writing, National Fuel Gas is selling at $41.91, so according to the model the company is currently undervalued.
Attempting to Fix the Fix
Another difficulty with the model is that the dividend growth rate will almost certainly not remain fixed. Over the years the growth may change dramatically – for years it can settle at a particular rate and then change to another rate – in which case some move towards a multi-stage DDM. This scenario involves assuming a growth rate for a particular number of years, then changing that growth rate for a subsequent period. In theory, this should allow one to arrive at a more precise valuation.
First, an aside. I worked as a Webmaster and programmer for an organization that held an event. The president gave me the raw data and asked me to reduce it and place the information on the website. In my report to him, I included the fact that exactly 3,000 people had attended the event. He did not want to use the number because he felt that readers might think that it was an estimation and had me change the number. I lowered it to 2,987, 13 shy of the actual figure because I did not want to do it and 13 is an unlucky number. This was a case of a pretense of accuracy.
I appreciate that others feel that a multi-stage approach to the Dividend Discount Model might be more accurate, but for me, this is another case of pretense of accuracy. On top of the assumptions that have already been made we are now being asked to look even further into the future to make guesses on not one but at least two growth rates as well as the periods to hold them. A difficult task has now been made considerably more difficult, and even more improbable to accomplish.
My suggestion is that one not bother with the multi-stage approach. If the concern is that the dividend growth rate could change over time (which it almost certainly will do), and this will affect the purchase decision, then perhaps a larger margin of safety will assuage those doubts.
An Added Advantage of the Dividend Discount Model
“The intelligent investor realizes that stocks become riskier, not less, as their prices rise—and less risky, not more, as their prices fall. The intelligent investor dreads a bull market since it makes stocks more costly to buy. And conversely, you should welcome a bear market, since it puts stocks back on sale.”Benjamin Graham – The Intelligent Investor
This quote is from Chapter 8 of Graham’s book, Buffett’s other favorite.
We do not talk about this enough. If you are in the accumulation phase of your investing career then downturns are a good thing. While the prevailing thought is to, like the Ancient Mariner, stop people on the street to bemoan to them what percentage of one’s portfolio has been lost (actually, you have not lost until you sell), your proper action is to seek to purchase quality stocks that are on sale.
The DDM helps to identify such stocks and reinforces the mindset that stocks should only be purchased at a proper price point. We are certainly within a recession at present so the model will show a large number of stocks on sale. During a bull market, the selection becomes narrower. Adhering to the model one will be cautioned away from companies that are overpriced during this time.
As long as the investor remains committed to an unemotional evaluation of companies, outside influences telling them to buy when prices go up and sell when they go down are drowned out by a logical valuation system.
The Dividend Discount Model is a system that is valuable to the dividend investor by identifying companies that are selling for less than they are worth. It is not a full system in the respect that it encompasses a complete decision-making process, but is a beneficial part of the proper diligence one should perform before trading their hard-earned money for the hopes of multiplying it in the future.
As a “for instance”, the previous calculation performed for National Fuel Gas indicates that the company is on sale with a healthy margin of safety – but is the company a buy? I did open a position in May, as noted in the article Future Dividend Kings – National Fuel Gas Company. However, as is the case when shopping, just because something is on sale, that does not necessarily mean that it should be purchased.
One of the reasons the company is selling well below its proper value is that the price of gas has dropped dramatically. Each of the company’s segments is tied to the price of natural gas, and the commodity’s decline affected the company’s holdings in a way that its ceiling test forced a reduction in their earnings.
The cyclical nature of gas and oil prices is a fact that the investor must understand when considering a purchase of this nature. It is doubtful that the price of natural gas will significantly increase soon so those who are patient have ample time to accumulate shares while those demanding more immediacy are sure to be disappointed.
For me, the purchase of National Fuel Gas made sense not only because I have the patience to wait for the cycle to change, but it also filled a gap on my portfolio left by my sale of Exxon in December.
The DDM is a tool to be used in the research stage, and its results should be used with other factors to make an informed decision.
Finishing Up
The Dividend Discount Model offers help deciding the appropriate valuation of a company that offers dividends. High dividend companies do not work with the model but it should be noted that this, like all such models, is a tool to be used at the appropriate time. The most wonderful screwdriver in the world is useless as a hammer, so similarly the DDM should be used when the company is germane to the model’s intentions.
Despite its shortcomings, the Dividend Discount Model is valuable when considering the purchase of large stable companies. It requires several assumptions, as is the case with all forward-looking formulas, but the more knowledgeable one is with the company, the closer these assumptions may be to reality. This is why I consider using it toward the end of my search for knowledge, as opposed to an initial screen. Used properly the Dividend Discount Model is important as part of a coordinated system of research.
