Everyone needs to be able to keep track of their portfolio and there are numerous means available to us for doing so.
You can either opt for DRIP brokers with in-built portfolio tracking capabilities, try our DRIP calculator, or go for something very complete, like Stock Rover, which is a great piece of software that offers an incredible range of information.
Start with Interactive Brokers
The downside is that its completeness is accompanied by a rather steep learning curve. The other end of the spectrum is to start with something simple and easy to use, though it may not have the capabilities other means of tracking offer.
Many years ago I created an Excel spreadsheet that used Yahoo to get current information and it worked quite well.
Yahoo then ended this ability so I found another source and rewrote the formulas.
That source, too, then went away and I had the impression that I might get involved in a never-ending task of rewriting the spreadsheet to backfill vanishing resources.
I changed it to rely on the user to manually update the information. This was not convenient but it was something.
Google offers the ability to automatically update a spreadsheet with the current price information, so I have again rewritten the spreadsheet to work with Google Sheets.
It does mean that one needs to have a Google account (free, of course), but hopefully, the information Google offers will continue well into the future.
My idea is to offer a starting point and let the user take it where they feel it needs to go – or simply use it as it comes. You can offer enhancements to what I have done and modify it for your design. I need something simple so that at a moment’s glance I can see the state of my portfolio, but we all have our own needs.
Below are instructions on how to alter the example spreadsheet for your personal use. While the spreadsheet does have a .xlsx extension and will open in Excel, it will not work properly within this software. It is designed for Google Sheets and only works on that platform.
For those who are familiar with Excel much of the following explanation is superfluous, but I wanted to offer a fairly full description to those less familiar with the software.
How to Import the Spreadsheet into Google Sheets
After downloading the spreadsheet (Dividend Spreadsheet for Google Sheets) upload the file to Google Drive. Double-click Dividend Spreadsheet.xlsx to open it.
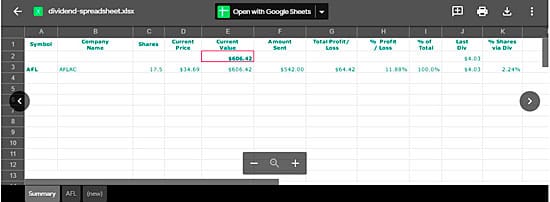
Although this example spreadsheet opens it will not work properly, as it first needs to be saved as a Google Sheet so that it can tap into the platform’s capabilities. To open the spreadsheet for use click “Open with Google Sheets”, then save the file by going to File and select “Save as Google Sheets”. Saving in this manner only needs to be done once, as all subsequent changes will be saved automatically. The program is now ready to be used. In Drive the “Dividend Spreadsheet.xls” file may be removed, as it is no longer be needed.
How to Use the Dividend Spreadsheet for Google Sheets
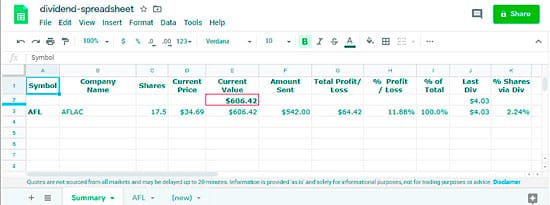
The spreadsheet comes with an example stock from my portfolio (Aflac), as well as some sample purchases and dividend reinvestments.
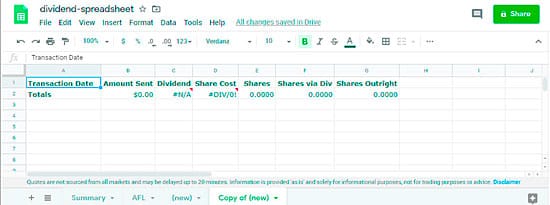
1 – To add a stock to the spreadsheet we need to copy the formulas from the “(new)” sheet into a blank sheet that will hold our transactions for this added stock. We will then update the “Summary” sheet to connect to this new sheet, which will populate information from the newly created sheet.
The sheet “(new)” is the blank sheet with the formulas. To copy “(new)” to a new sheet select “(new)”, click the down arrow next to the name and select “Duplicate”. This will result in a new sheet titled “Copy of (new)”.
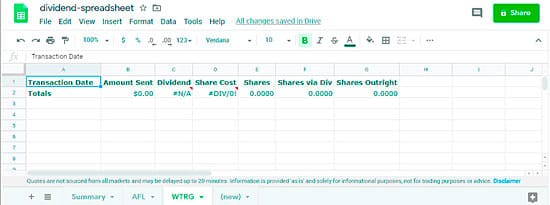
2 – Rename the newly created sheet by clicking the down arrow to the right of the newly created sheet, select Rename, enter the new ticker and press Enter (WTRG, the ticker for Essential Utilities, is used in this example). The tab can be moved by click-holding and moving to the desired location.
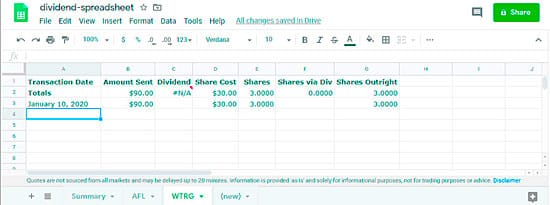
3 – We are now able to begin entering information into the WTRG sheet. Let’s say that on 1/10/2020 you bought 3 shares at $30 each. In the WTRG sheet enter the date of the transaction into A3, the total cost of the shares into B3, the price of each share into D3 and the number of shares into E3.
4 – On 2/3/2020 we received a dividend of $1.65 with the share cost of $31, resulting in 0.055 shares. Enter the date of the dividend, dividend amount, cost per share, and the number of shares into cells A4 and C4-E4. The number of shares could have been calculated instead of having to enter them, but there could be fees associated that would alter this simple calculation, so it is easiest to simply enter all of the information.
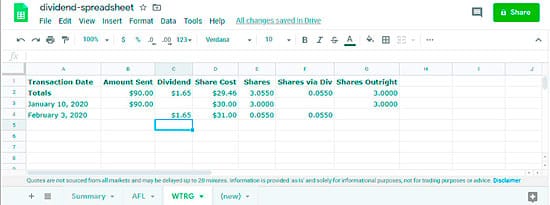
5 – As can be seen, the initial errors in row 2 have been resolved. Also, columns F and G show the shares that have been obtained either through outright purchase or dividend. This is just “interesting to know” information that will be reflected on the Summary sheet so that one can see what percentage of their shares come through dividend reinvestment.
The value in cell C2 is the most recent dividend and will show on the Summary sheet. The Summary sheet will total these values for all securities so if they are all quarterly dividends then one will know how much they are receiving each quarter.
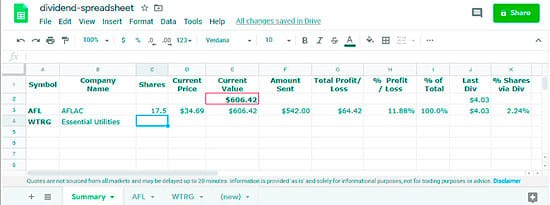
Return to the “Summary” sheet. Enter the new ticker into cell A4 and company name into B4.
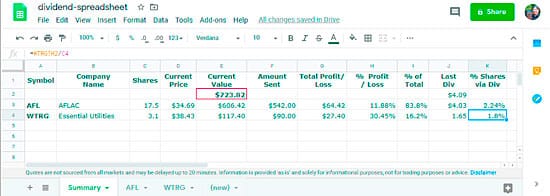
6 – It is now time to link the new sheet to the Summary sheet. This is done by entering formulas into the appropriate cells. We need to do this for cells C4, F4, J4 and K4.
The value within the single quotes in the below formulas is the ticker used to identify the new sheet. In our example that ticker is WTRG.
- C4 Enter =’WTRG’!E2 and press Enter (including the equals sign)
- F4 Enter =’WTRG’!B2 and press Enter
- J4 Enter =’WTRG’!C2 and press Enter
- K4 Enter =’WTRG’!F2/C4 and press Enter
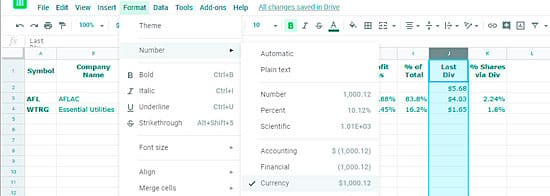
Sometimes the formatting is not maintained, though the above is probably my fault (note cell J4). This may be the result of transferring the sheet in and out of Google Sheets while testing for this article. Correcting the issue is easy if it happens to you. Simply click the column heading “J”, which will select the entire column, then select Format – Number – Currency.
The spreadsheet now has the basic information needed to track your dividend portfolio. There are many enhancements you may wish to add to the spreadsheet.
Google offers a listing of financial formulas that can be included. For instance, you may wish to add the beta of a company to the spreadsheet. On the above-noted link, it offers:
- “beta” – The beta value.
To be used within the formula:
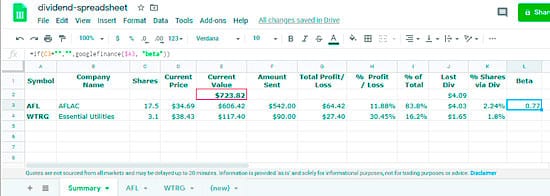
GOOGLEFINANCE(ticker, [attribute], [start_date], [end_date|num_days], [interval])To add beta to the spreadsheet enter “Beta” as the heading in cell L1, then in cell L3 enter:
=if(C3="","",googlefinance($A3, "beta"))and press Enter.
Breaking this apart, googlefinance($A3, “beta”) is the operative part of the formula. $A3 points to the value found in cell A3, which is AFL, so it translates to:
googlefinance(‘AFL’, "beta") if(C3=””, …) simply looks at cell C3 to see if anything is there – if not then nothing will be displayed in the cell.
Finishing Up
For those new to working with spreadsheets, by hovering over the nub on the lower right of the selected cell then click-holding, the formula can be copied to lower cells by dragging down (or up, or to the side, depending upon the direction in which it is to be copied). Google has quite a few other options that may be of interest, but unfortunately for me, the ones of most interest me are only available for mutual funds, which is another reason I use Stock Rover or another resource when researching stocks.
If you do not already have something then this is a start. Fortunately, it is easy enough to use that over time you can customize it to fit your exact needs.
